QuantWealth Advisors

Categories
QuantWealth

The Active Decision Inside Every Passive International Portfolio

International index investing works differently from domestic index investing. Before anyone can build an index for “the international market,” someone has to decide which countries count as developed, which count as emerging, which qualify as investable at all, and how much weight each one gets in the final portfolio. None of those questions has an objectively right answer. The three major index providers — FTSE Russell, MSCI, and S&P Dow Jones Indices — have answered them differently for a quarter century, and their disagreements quietly reshape the portfolios of every investor who buys their funds.

The largest single disagreement is South Korea. Korea now has the world’s eighth-largest equity market by capitalization, having recently surpassed the United Kingdom on the back of a semiconductor-led rally. The country is home to Samsung Electronics and SK Hynix, two of the most important companies in the global semiconductor supply chain. FTSE classifies it as developed. MSCI classifies it as emerging. S&P sides with FTSE. Where Korea sits in your portfolio — and how much of your portfolio it represents — depends entirely on which index family is behind your ETFs. Most international investors have never thought about this decision.


The three index families

Almost every international ETF available to U.S. investors is built on top of one of three index families:

FTSE Russell is the index arm of the London Stock Exchange Group. FTSE classifies South Korea as a developed market and has done so since 2009. Vanguard’s international ETFs follow FTSE methodology. Schwab’s flagship international fund does as well.

MSCI is the largest of the three by institutional assets and is the standard benchmark most pension funds and endowments measure against. MSCI classifies South Korea as an emerging market and has held that view since 1992. iShares uses MSCI methodology for its core international lineup. Avantis and Dimensional do too.

S&P Dow Jones Indices runs the S&P 500 and is the third major provider. S&P has classified South Korea as a developed market since 2001. State Street’s SPDR portfolio international funds follow S&P methodology.

Two of the three providers say developed but one says emerging.


Four emerging-markets ETFs, four very different Korea exposures

Look at the four most widely used emerging-markets ETFs in the U.S. market and the consequences of these classification choices become clear.

ETFIssuerIndexKorea Weight
IEMGiShares (BlackRock)MSCI EM IMI15.4%
VWOVanguardFTSE Emerging0%
SPEMState Street SPDRS&P Emerging BMI0%
AVEMAvantisMSCI EM IMI (active)15.6%

Korea weights as of recent fund disclosures. AVEM weight as of 3/31/2026 per issuer fact sheet.

Two of the four major emerging-markets ETFs hold zero Korea. SPEM and VWO both follow indexes that classify Korea as developed, so neither owns Samsung Electronics, SK Hynix, or any other Korean stock. An investor who bought either fund expecting “broad emerging markets exposure” was structurally absent from the entire AI memory cycle.

IEMG sits in the middle. The MSCI EM IMI index that BlackRock tracks places Korea at roughly 13% of the fund. That weight has powered IEMG’s recent performance, since Samsung and SK Hynix have been among the largest contributors to MSCI emerging-markets returns since 2024.

AVEM is the highest-Korea fund of the four despite being the only one that’s actively managed. Avantis benchmarks against MSCI EM IMI but tilts the portfolio toward smaller-cap, value, and high-profitability stocks. Korean memory names, which trade at low book multiples and generate strong returns on capital, get systematically overweighted by the model. 

The performance gap over the trailing twelve months ending May 2026 made the math visible:

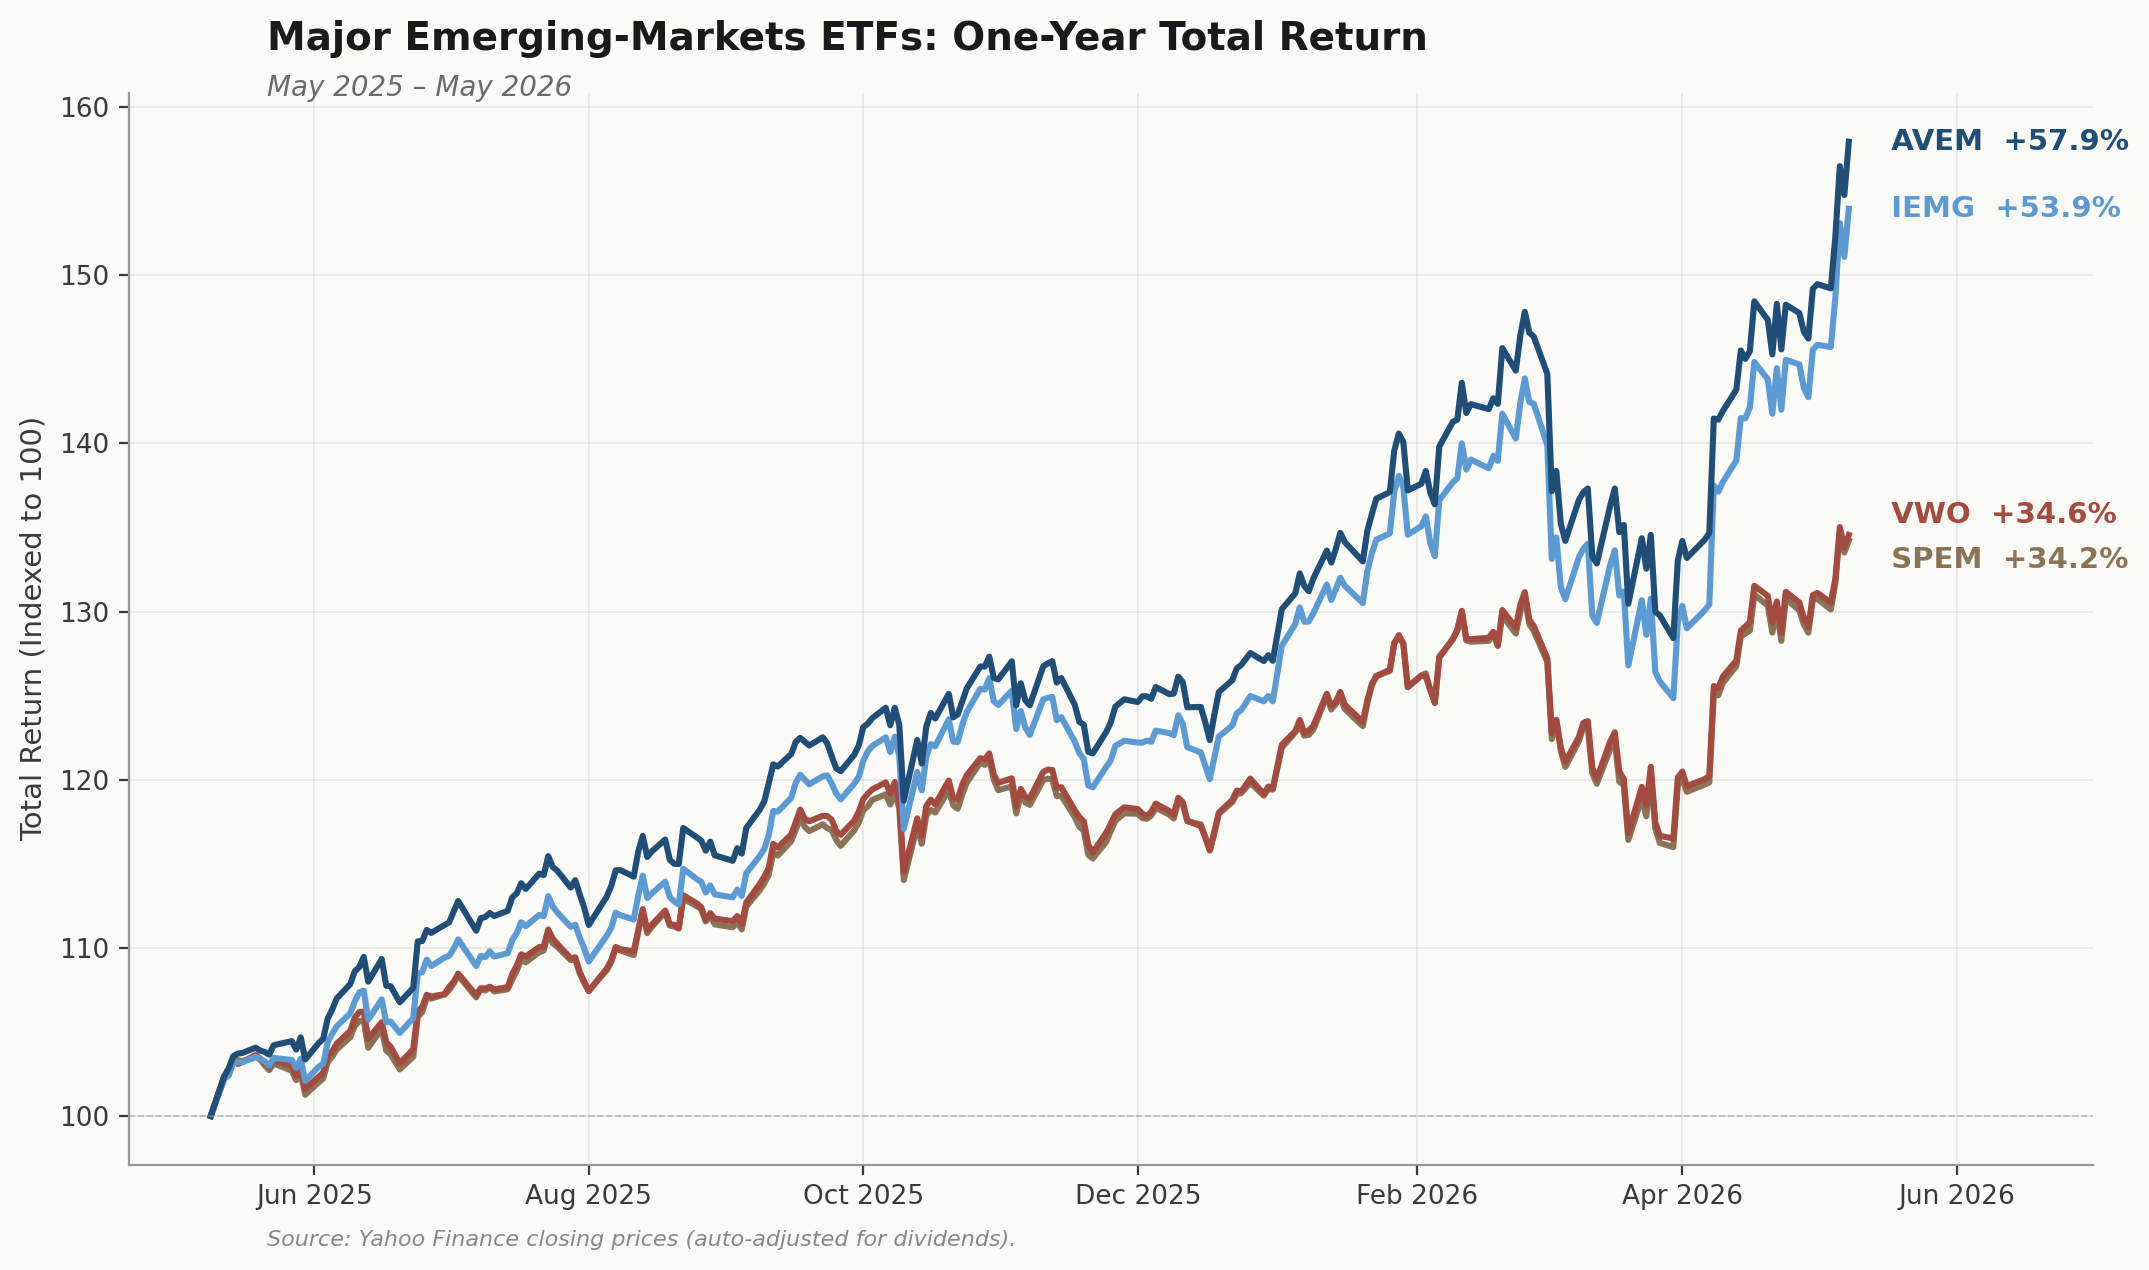
AVEM (Korea 15.6%) returned +57.9%. IEMG (Korea 13.3%) returned +53.9%. VWO and SPEM, both with zero Korea exposure, returned +34.6% and +34.2% respectively. The gap between the highest-performing fund (AVEM) and the lowest (SPEM) was 23.7 percentage points. All four are marketed as broad emerging-markets ETFs.


Conclusion

Passive portfolios are full of active decisions. Those choices are made by the index provider before the ETF is built, and the investor inherits them whole.

Passive investing is one of the most powerful tools available to long-term investors. It just isn’t as automatic as it looks the moment you cross the U.S. border.


This commentary is provided for informational purposes only and does not constitute investment advice or a recommendation to buy or sell any security. ETF holdings, index weights, and performance figures cited are as of dates referenced and change over time. QuantWealth Advisors LLC is a fee-only registered investment adviser.

Categories
Equities

Is the S&P 500 still a passive index?

The S&P 500 is widely regarded as the gold standard of passive investing — low fees, broad exposure, no manager second-guessing valuations. For most of the past three decades, that characterization was largely accurate.

That is about to change.

SpaceX filed a confidential S-1 with the SEC targeting a listing at $1.75 trillion. Anthropic and OpenAI will likely follow at trillion-plus valuations. Roughly $4 trillion in new market cap is queuing for index inclusion — a potential combined weight of 7-8% of the S&P 500 from day one compared to historical re weightings of 1-2%


What Happened With Tesla

The Tesla addition in December 2020 is the clearest case study of what forced index buying looks like in practice.

By the time the S&P committee added Tesla, the stock had risen 730% that year. Index funds collectively purchased roughly $94 billion of Tesla at peak pricing, on a known date, with the entire market positioned against them.

Research Affiliates studied 31 years of S&P 500 rebalances and found a consistent pattern:

  1. Additions underperform the index by an average of 14% in the first six months.
  2. By month 12, that underperformance widens to 20%.
  3. Deletions tend to outperform — they are sold at distressed prices and then recover.

Tesla confirmed this precisely. The stock fell 6% on its first day in the index. Meanwhile, Apartment Investment and Management — the REIT deleted to make room for Tesla — outperformed Tesla by 78.6% in the six months that followed. The company that got kicked out beat the company that got added by nearly 80% almost immediately. Research Affiliates calculated the rebalance cost index investors 41 basis points in those first six months alone.

Cap-weighted indices are structurally built to buy high and sell low. Historically this cost ran 20 to 40 basis points annually — small enough to ignore. SpaceX entering at 3 to 4% of the index is a categorically different situation.


The Arbitrage Problem

Index fund managers know exactly what they have to buy and when. So does everyone else.

When an addition is announced, hedge funds immediately buy ahead of the forced flows, accumulate the position, then sell to index funds at the effective date and capture the spread. This dynamic is well documented. Research shows a buy-and-hold portfolio that simply never rebalanced outperformed the annually reconstituted Russell 2000 by 2.22% over one year and 17.29% over five years — the reconstitution itself was the return drag. The S&P SmallCap 600, which updates constituents throughout the year rather than on a single predictable date, has consistently outperformed the Russell 2000 over equivalent periods for exactly this reason.

For the S&P 500, front-running has historically been manageable because additions enter at 0.02 to 0.15% of the index. SpaceX at 3 to 4% — on a known date , with $24 trillion in assets forced to transact is not.”


The Rules Are Being Rewritten

What has received less attention than the IPO valuations: the index rules are being changed to accelerate forced buying — and the push came from SpaceX’s own advisers, who approached Nasdaq directly to request expedited inclusion.

Nasdaq complied. Effective May 1, large-cap IPOs ranking within the top 40 of the Nasdaq 100 can be included within 15 trading days of listing, down from roughly three months. The minimum float requirement was also removed. S&P Dow Jones Indices and FTSE Russell are both now considering similar fast-track changes.

The old observation period existed for a reason: it gave IPO premiums time to partially deflate before index funds were forced to buy. Compressing that to 15 days removes the last structural protection passive investors had — and it was done explicitly to benefit IPO insiders seeking liquidity, not the passive investors who will be buying from them.


The Takeaway

The S&P 500 has never been fully passive. But costs were historically small enough that the structural advantages of low fees and broad diversification easily outweighed them.

That calculus is shifting on two fronts simultaneously: three trillion-dollar companies entering at peak private market valuations, and rules being rewritten — at the explicit request of IPO insiders — to accelerate the forced buying that benefits them at the expense of passive investors.

The index has delivered roughly ~10% annualized since inception and that long-term record is real. The question for investors is whether the passive S&P 500 is still the right implementation — or whether direct indexing, factor tilts, or selective active management in the large-cap space is worth the conversation as these additions approach.


Disclosure

This content is for informational and educational purposes only and does not constitute investment advice or a recommendation to buy or sell any security. Past performance is not indicative of future results. Valuation figures sourced from public reporting as of April 2026. Research Affiliates data cited from “Revisiting Tesla’s Addition to the S&P 500” (Arnott, Kalesnik, Wu, 2021). Investors should consult a qualified financial advisor before making investment decisions.

Categories
Private Investments

Do Secondary Evergreen Private Equity Funds Demonstrate Long-Term Performance?

Secondary Evergreen Private Equity (PE) funds have expanded rapidly in recent years, offering investors diversified access to seasoned private equity investments with semi-liquid structures and faster deployment profiles. In a previous blog post, I discussed why investing early in these funds can be particularly advantageous: Why Investing Early in Secondary Evergreen PE Funds Is So Powerful.

As more investors consider Evergreen secondary funds as strategic long-term allocations rather than tactical short-term opportunities, an essential question arises:

Do Secondary Evergreen PE funds demonstrate durable long-term performance?

The challenge is that most of these funds are relatively new, with limited operating histories. As a result, understanding their long-term potential requires analyzing performance patterns across the small set of managers with track records long enough to evaluate.


Performance Summary of the Oldest Evergreen Secondary Funds

Below is a consolidated snapshot of four of the longest-running Evergreen Secondary PE funds. Stepstone Private Markets Fund is the newest among them, having just passed its five-year anniversary.

These figures capture each fund’s trailing 1-year return, 5-year annualized return, and since-inception annualized performance.


Summary Performance Table


What the Data Suggests

When comparing long-term and short-term results across these funds, several patterns emerge:

  1. The trailing 1-year average return is meaningfully lower than the trailing 5-year return across these funds.
    Specifically, the trailing 1-year performance is 8.15% lower than the trailing 5-year annualized figure.
  2. The trailing 1-year performance also trails the since-inception annualized numbers by an average of 7.16%.
  3. Long-term returns appear strong, but a portion of this strength likely reflects early-period conditions—particularly wider secondary discounts available in 2020–2021 that later compressed, producing significant mark-ups.
  4. Recent performance has softened across the category, suggesting that the early tailwinds should not be assumed to persist indefinitely.

Given the small number of funds with multi-year histories and the relatively short existence of the Evergreen secondary structure itself, forming definitive long-term conclusions remains difficult.

Some funds continue to raise assets rapidly, benefiting from scale, sourcing, and flow advantages. Others are experiencing slower inflows, which can affect deployment pace, liquidity profiles, and future performance. These differences make cross-fund comparison challenging.


Possible Reasons for Recent Underperformance
  1. Early returns were boosted by unusually large secondary discounts                                                                                       Growing AUM and larger discounts produced outsized gains that are unlikely to repeat
  2. Private equity performance has slowed broadly                                 PE distributions have declined, transaction volumes remain lower, and valuations have been more muted. Evergreen funds holding secondary positions naturally reflect this environment.
  3. Not all discounted secondary deals were high quality                      Some managers purchased discounted interests for which the underlying fundamentals later proved weak. Some of the larger discounts led to the funds having weak assets.
  4. Secondary discounts today are much tighter                                      With fewer distressed sellers and more capital pursuing secondary opportunities, the pricing advantage enjoyed by these funds early on has largely dissipated.

Conclusion

Evergreen Secondary Private Equity funds have delivered strong long-term performance to date, but a meaningful portion of those returns was driven by unique early conditions—namely wide discounts and robust inflows. More recent results show a noticeable slowdown, reflecting both market-wide private equity headwinds and the natural maturation of the strategy.

While it is still too early to draw firm conclusions about long-term durability, investors should monitor the category closely, focusing on discount discipline, sourcing quality, AUM stability, and manager selection as key drivers of outcomes going forward.


Disclosures

This content is for informational purposes only and does not constitute investment, tax, or legal advice. Past performance is not indicative of future results. Private equity and secondary investments involve substantial risks, including loss of principal, illiquidity, long time horizons, and reliance on underlying manager valuations. Evergreen private equity structures vary significantly across providers. Investors should carefully review offering documents and consult qualified professionals before making investment decisions.

Categories
Equities

The End of Diversification for S&P 500 Investors

Over the past three years since the introduction of ChatGPT, the S&P 500’s rally has been powered by one dominant theme: Artificial Intelligence.

While the Magnificent 7 dominate headlines and index returns, our analysis shows that the AI narrative runs much deeper. From semiconductors and data-center utilities to asset managers trading AI-linked equities, roughly 70% of the S&P 500’s market capitalization now has meaningful AI exposure. Nearly half of all companies in the index derive direct or indirect benefit from the AI boom.

That concentration has created enormous opportunity—and a growing systemic risk.


The Illusion of Diversification

The S&P 500 is marketed as a diversified representation of the U.S. economy. In reality, it has become a crowded bet on a single technological narrative.

  • Information Technology, Communication Services, and Industrials together account for more than half of the index’s weight, and nearly all of those firms are levered to AI infrastructure, cloud computing, or automation.

  • Even the so-called Consumer Discretionary sector is misleadingly concentrated, dominated by just two AI-heavyweights: Tesla and Amazon.

  • Add Financials—broker-dealers, asset managers, and exchanges whose revenues depend on AI-driven trading activity and valuations—and Utilities and REITs that power and host data centers, and roughly seven out of every ten dollars in the S&P 500 ride on the same macro story.

When investors believe they own “the market,” they may in fact own a single high-beta growth factor in disguise.


The Risk of an AI-Driven Sell-Off

AI is undeniably transformative and will reshape society and business in profound ways. Our goal is not to declare a bubble or make valuation calls, but rather to measure the risk of an AI-driven correction within the S&P 500.

As of October 31, 2025, our analysis shows that 69.8 % of the S&P 500’s market capitalization—and 241 of its 500 companies—are exposed to AI-related themes.

Moreover, the top 10 % of U.S. households by income account for roughly 40 % of total consumer spending. These same households also own a disproportionate share of U.S. equities. An AI-led correction would therefore generate a wealth-effect feedback loop that could exacerbate the selloff if there is a sustained drop in the market.


Portfolio Implications

For decades, the S&P 500 offered cheap, broad diversification. That assumption no longer holds.

Investors now face two choices:

  1. Stay market-weighted and accept higher concentration and reduced diversification.

  2. Rebalance toward areas less dependent on AI—such as small/mid-cap equities or international markets or niche alternative assets—to restore balance.


The Takeaway

AI has evolved from a single sector into the engine of U.S. equity valuations—marking the end of an era for effortless diversification.

For investors, the S&P 500 no longer offers true balance across sectors. When one narrative drives both earnings and market capitalization, a passive portfolio does not offer the risk management one would expect.

Understanding where AI lives inside your portfolio is now essential.


Methodology: How AI Exposure Was Computed

QuantWealth Advisors analyzed all 500 S&P constituents using a bottom-up tagging framework that combines GICS classifications, company business descriptions, and economic correlation channels.

CategoryIncluded Companies / SectorsRationale
Direct ProducersNVDA, MSFT, GOOG, META, AVGOCore AI enablers and platforms
Financial CorrelationGS, MS, JPM, BAC, BLK, BX, SPGI, MSCI, ICE, CME, SCHWMarket activity and AI-linked equity flows
Insurance & Private CreditPRU, MET, AIG, HIG, OWL, ARES, BX, KKR, APO, CGAsset-market sensitivity and liquidity exposure
Power InfrastructureNRG, VST, CEG, NEE, DUK, D, AESData-center energy demand
Data-Center REITsEQIX, DLR, AMT, CCI, PLDHosting and connectivity for AI compute
AI Capex Supply ChainETN, HUBB, HON, EMR, J, PH, CATElectrical equipment and engineering
Consumer AI LeadersAMZN, TSLACloud (AWS) and autonomous AI exposure
ExcludedAirlines, Railroads, Logistics, Deere (DE), Cummins (CMI)Users of AI, not beneficiaries; low earnings correlation

After merging dual-share listings (Alphabet, Fox, News Corp) into single parents, the analysis covers 500 companies.
241 companies (≈ 48 %) are classified as AI-exposed, representing ≈ 69.8 % of total S&P 500 market weight.


Disclosure

QuantWealth Advisors LLC provides investment advisory services. The information above is for educational purposes only and is not a recommendation to buy or sell any security. We make no guarantee that our study perfectly measures AI exposure, as several subjective judgments were required to determine the degree of linkage to the AI theme.

Categories
QuantWealth

International Funds: Rethinking Asset Location for Tax Efficiency

 Diversification across global markets has long been a cornerstone of modern portfolio theory. Many investors naturally allocate to international developed and emerging-market funds to broaden exposure beyond U.S. borders.
Most asset-allocation models include at least 20% international equity, and virtually all target-date funds maintain a meaningful global component.

However, few investors consider where those holdings should reside — in taxable or retirement accounts — even though this decision can  impact long-term after-tax returns.


Why International Funds Can Be Tax-Inefficient

Unlike U.S. equities, foreign stocks are subject to dividend withholding taxes imposed by their home countries. These taxes typically range from 0% to 30% of the dividend amount and are non-recoverable inside tax-deferred accounts such as IRAs, 401(k)s, and Roth IRAs.

To make matters worse, international markets tend to have higher dividend yields than U.S. markets.
This occurs because:

  • International companies often have lower valuations/growth profiles and higher payout ratios.
  • Many use dividends instead of stock buybacks to return capital to shareholders.

For example in the most popular ETF which are also available as funds inside 401(k)s:

  • Vanguard S&P 500 ETF (VOO): ~1.15% dividend yield
  • Vanguard Total International Stock ETF (VXUS): ~2.75% dividend yield

 How Inefficient Is It?

Roughly 10% of VXUS’s dividends are withheld by foreign countries each year.
For large-cap, broadly diversified international funds, 10% is a reasonable rule of thumb for “foreign taxes paid.”

That means:

On a 2.75% yield, an investor forfeits roughly 0.3% annually in foreign withholding taxes when holding VXUS in a retirement account.

For context, VXUS’s expense ratio is only 0.05% — meaning this tax drag is six times larger than the fund’s stated expense.

In taxable accounts, investors can typically claim a foreign tax credit on their U.S. return to offset this cost.
But in retirement accounts, there is no credit available — the withholding is a permanent loss.


Dividends in Taxable Accounts: Qualified vs. Non-Qualified

If you hold international funds in a taxable account, you’ll owe tax on their dividends each year.
Here’s the catch: not all dividends are taxed equally.

  • Qualified dividends are taxed at lower long-term capital gains rates (0%, 15%, or 20%).
  • Non-qualified dividends are taxed at ordinary income rates, which can be as high as 37%.

U.S. equity ETFs like VOO typically have 99–100% qualified dividends, meaning almost all their income receives the lower rate.
International ETFs are different is that a lower amount of the dividends are qualified. For VXUS, only ~60% of the dividends are qualified.


Why Only ~60% of VXUS Dividends Are Qualified

VXUS, which tracks the total international market, typically reports only ~60% of its dividends as qualified.
The remaining 40% are taxed at higher ordinary income rates.

There are several reasons:

  1. IRS Treaty Test
    Only dividends from countries with a U.S. tax treaty and proper documentation qualify.
    VXUS holds many non-treaty markets — such as Brazil, Singapore, and Taiwan — disqualifying a large portion of its income.
  2. Corporate Structure
    Some foreign firms operate as holding companies, state-owned entities, or REIT-like structures, whose distributions fail to meet the IRS definition of “qualified dividend income.”
  3. Documentation Gaps
    For a dividend to be reported as qualified, the ETF provider must document eligibility.
    If not verifiable, the IRS requires it be classified as ordinary.

Bottom Line

In spite of the qualified funds, for broad large cap international funds, it still makes sense to put them in taxable accounts instead of tax deferred account since the foreign tax credit can be claimed.

Most investors recognize that bond and fixed-income funds belong in retirement accounts for tax efficiency, whereas international funds typically work better in taxable accounts.

Strategic asset location — not just allocation — can meaningfully improve long-term after-tax outcomes.

Emerging market funds, small cap international funds and global real estate funds have different tax withholding rates and lower qualified dividends. We will explore later whether it makes sense to put them in taxable accounts too


Disclosure

This material is provided for informational and educational purposes only and should not be construed as individualized tax or investment advice.
Investors should consult with a qualified financial advisor or tax professional before making investment or asset-location decisions.
All data sourced from Vanguard fund reports (2022–2024) and public tax documentation as of October 2025.

Categories
QuantWealth

Buy the individual stock or the sector ETF?

Buffett’s Apple (AAPL) purchase is often called one of his greatest bets ever. It checked every box of his investing philosophy while delivering extraordinary absolute returns. Berkshire started buying in Q1 2016 when Apple traded at around $25 (split adjusted). The investment alone accounts for over 40% of Berkshire’s entire stock portfolio at times.

But even Buffett isn’t immune to portfolio management realities. Beginning in late 2023, Berkshire started trimming its Apple stake for tax and concentration reasons, though Apple remains its largest single holding.


Return Comparison

If you had bought Apple stock on 12/31/2015 and liquidated on 6/30/2025:

  • Annualized return: 25.47%
  • Total return: 762.68%

If instead you had bought the Vanguard Information Technology ETF (VGT):

  • Annualized return: 22.20%
  • Total return: 571.38%

On paper, Apple crushed the ETF. But investing is not just about gross returns—it’s about after-tax returns.


Diversification offered by sector ETF’s

Holding a diversified sector ETF also means you don’t have to worry about company-specific risks:

  • Will Apple keep pace in AI?
  • Will Siri ever catch up to competitors?
  • Will regulation hit margins?

Those risks get smoothed out across the broader technology sector. Even Buffett himself—arguably Apple’s biggest champion—has been forced to trim for diversification reasons.


The Tax Drag on Individual Stocks

The challenge with owning a single stock is that you often need to sell at some point—for rebalancing and risk management. Every sale in a taxable account creates a capital gains tax event.

Looking at returns from an after tax perspective for AAPL compared to the before tax returns of VGT, (not an apples to apples comparison), which returns are superior?

  • At a 23.8% rate (20% long-term cap gains + 3.8% NIIT), Apple’s after-tax annualized return falls from 25.47% to 19.41%.
  • At a 33.8% rate (adding high state income taxes), the after-tax return falls further to 16.86%.

The Takeaway

Apple was a once-in-a-generation investment, and Buffett’s timing was exceptional. But for most investors, even a brilliantly placed single-stock bet can lose its edge once taxes and rebalancing needs enter the picture.

Sector ETFs like VGT may not always deliver the highest headline return, but they can deliver a better after-tax experience—and that’s the return that ultimately compounds into wealth.

Categories
QuantWealth

A Good Index, But Not a Good Fund

The Vanguard Extended Market Index Fund (VEXAX) and its ETF counterpart VXF are widely used products with nearly $100 billion in combined assets. Both are market cap–weighted and track the S&P Completion Index.

At first glance, the S&P Completion Index looks appealing: it represents every U.S. stock in the S&P Total Market Index (TMI) except those in the S&P 500. In theory, this gives investors exposure to mid-cap, small-cap, and micro-cap companies across all sectors.

But just as the Russell 2000 was created as a benchmark and later became a investable fund with structural flaws, the S&P Completion Index suffers from design issues that limits it usefulness as an investable fund.


Issues With the S&P Completion Index
  • No Profitability Screen

    Unlike the S&P 500, which only includes companies that have been profitable for at least a year, the Completion Index has no profitability requirement. That leaves it populated with lower-quality firms, distressed businesses, and speculative names.

    The most striking example today: the largest holding in the index currently is Strategy (formerly MicroStrategy, ticker MSTR), essentially a leveraged Bitcoin holding company. Because it can never show consistent profitability under GAAP accounting, it will never qualify for the S&P 500—yet it is the first name on the Completion Index.
  • Large-Cap Creep

    Although designed to track small- and mid-sized companies, the index is built simply by excluding the S&P 500. The result: a surprising amount of large-cap exposure sneaks in. According to VettaFi, nearly 35% of the Completion Index is actually large caps, diluting the intended exposure.

  • Easy Entry for IPOs and SPACs

    To join the S&P 500, companies must meet stricter criteria, including that a significant portion of shares be publicly held. No such guardrail exists for the Completion Index. This means recent IPOs and de-SPACs can enter quickly, often at inflated valuations and without profitability. During speculative surges like 2021, this leads to a flood of overpriced, low-float companies being added—an outcome that harms long-term returns.

  • A Dumping Ground for S&P 500 Discards

    When companies are removed from the S&P 500—often due to shrinking market caps, obsolete business models, or poor management—they don’t disappear. Instead, they slide into the Completion Index. Many of these “fallen angels” languish for years, dragging down performance.


The Few Advantages

The Completion Index does have some benefits:

  • Pipeline to the S&P 500: Companies promoted into the S&P 500 start out in the Completion Index, so investors can benefit from the “index pop” when those stocks are included in the S&P 500.
  • Low Cost and Tax Efficient: Like most Vanguard index products, VEXAX and VXF are inexpensive and tax-friendly, avoiding the inefficiencies of active management.

Key Takeaways

The S&P Completion Index is a good benchmark but a flawed fund. Its lack of profitability screens, large-cap creep, easy inclusion rules for speculative IPOs/SPACs, and role as a dumping ground for fallen S&P 500 companies make it less attractive as a core holding.

With so many alternatives for small- and mid-cap exposure, this is not a fund I’d put at the top of the list.

Categories
QuantWealth

Is Berkshire Hathaway a Predictor of the S&P 500?

Berkshire Hathaway’s stock often plays a unique role in markets. Like gold, it can act as a safe haven: when investors get nervous, they shift into Berkshire, trusting Warren Buffett’s ability to seize opportunities in downturns — just as he did in 2008 by buying distressed assets during the financial crisis.

But beyond being a “safety trade,” could Berkshire Hathaway stock also serve as a predictive signal for the S&P 500?


Berkshire vs. the S&P 500: Correlation Patterns

The chart below shows the 3 month rolling correlation between Berkshire Hathaway (BRK.A) and the S&P 500, plotted alongside the index itself:

An interesting pattern emerges. Each time the correlation dips below 0.4, a notable market drawdown has followed:

  • Early 2022 – Correlation fell below 0.4, followed by the S&P 500’s sharp decline as inflation surged and the Fed launched aggressive tightening.

  • August 2023 – Another dip below 0.4 preceded a 10.3% correction, triggered by “higher for longer” rate expectations.

  • March 2024 – The breakdown came ahead of a 5.4% drawdown.

  • June 2024 – A sustained drop below 0.4 preceded an 8.5% selloff, driven by the yen carry trade unwind.

  • Post-Election 2024 – Correlation again slipped under 0.4, foreshadowing the nearly 20% drawdown sparked by tariff fears.


Where We Stand Now

As of today, the Berkshire–S&P 500 correlation has once again fallen below 0.4.

History suggests this may be a warning sign of turbulence ahead. Of course, correlations don’t predict markets with certainty — but when a signal repeats across multiple cycles, it deserves investor attention.


Why It Matters
  1. Global sentiment proxy. Berkshire stock often reflects investor caution, as capital flows to Buffett’s fortress balance sheet during uncertain times.

  2. A potential early warning system. While not foolproof, the repeated pattern of low correlation preceding drawdowns suggests Berkshire may act as a leading indicator of stress.

  3. Risk management reminder. Whether or not history repeats this time, investors should use these signals to revisit allocations, diversification, and risk exposure.


Key Takeaway

Berkshire Hathaway isn’t just a conglomerate — it may also serve as a barometer of market sentiment. Each time its correlation with the S&P 500 has slipped below 0.4, the broader market soon experienced meaningful downside.

We’re seeing that signal again today. Whether it proves to be another warning shot or simply a statistical coincidence remains to be seen — but for investors, it’s a reminder to stay vigilant.

Categories
Equities

How Is Costco a Value Stock?

Much as I’d love to follow Peter Lynch’s advice and invest in companies I love as a consumer, it becomes significantly harder when those companies are trading at sky-high valuations.

One such company is Costco—a fan favorite for many of us, whether for its bulk bargains or the $1.50 hot dog combo. But Costco, the stock, has recently traded at eye-watering P/E (Price/Earnings) multiples approaching 60, making it more of a “browsing stock” than something you’d toss into your investment cart.


Shock and Awe

While casually browsing the holdings of the Avantis U.S. Large Cap Value ETF (AVLV), I did a double take—Costco was one of the top 10 holdings.

Even more surprising: its weight in the fund was greater than its weight in the S&P 500.
Wait… what?

How could a firm like Avantis, known for its quantitative discipline and value-driven approach, include a company trading at such lofty multiples in a value ETF—and give it an above-average weight?

Was Tesla next on the list?


The Plot Thickens

I knew that Avantis uses a combination of adjusted Price-to-Book (P/B) and adjusted Price-to-Earnings (P/E) ratios to rank stocks. Costco, to my knowledge, hasn’t done any major acquisitions, so its adjusted P/B should be very close to its reported figure—and that figure is high, roughly 12x, comparable to some tech names.

With both P/B and P/E running hot, I figured: this must be an error in their model.


Moment of Truth

I quickly sent an email to my ever-helpful Avantis counterpart to flag what I thought was a rare glitch in their quant matrix. A few emails and one Zoom call later—with a very patient analyst on the other end—my gleeful joy at unearthing the “find of the century” was gently laid to rest.

Here’s what I learned:

Context Matters in P/B

While Costco’s P/B ratio is high, its adjusted P/B—relative to other large-cap stocks in the large cap universe—puts it only in the 60th percentile. High, yes, but not disqualifying.

 Cash-Based Profitability Tells a Different Story

Avantis doesn’t rely on Net Income to assess profitability. Instead, they use a cash-based operating profitability metric, which excludes non-cash items like depreciation and adjusts for interest and taxes. This gives a clearer picture of how much cash a company actually generates.

And Costco? It shines.

Thanks to:

  • Upfront collection of membership fees
  • Delayed payments to suppliers
  • Low inventory holding periods
  • Depreciation from store buildouts

…Costco ranks well above average in cash-based profitability. According to Avantis, it lands in the top quartile of large caps using this metric.

 The Composite Score Still Wins

Even after factoring in its elevated P/B, Costco’s composite score using Avantis methodology, combining valuation and cash profitability, places it high in the rankings.


Key Takeaways
  • Using one simple ratio like P/E to judge whether a stock is expensive or not is a bad idea
  • In an environment where most large-cap valuations are elevated by almost every possible metric, even “value” stocks can look expensive by historical standards.
  • And most importantly: Trying to find “cheap” stocks in an expensive market is like trying to find clearance items in a luxury store. You can try—but set your expectations accordingly.
Categories
Private Investments

Why Investing Early in Secondary Evergreen PE Funds Is So Powerful

What Are Secondary PE Funds?

Secondary private equity funds—commonly referred to as PE secondaries—acquire interests in existing private equity funds or portfolios. Rather than participating in new (primary) fundraises, they purchase stakes from current investors such as Limited Partners (LPs) or through GP-led restructurings, often at a discount to Net Asset Value (NAV).


What Are Secondary Evergreen Funds?

Secondary evergreen funds combine the benefits of secondary strategies with an open-ended, semi-liquid structure. These funds:

  • Accept ongoing subscriptions (usually monthly),
  • Offer limited redemptions (typically quarterly),
  • Continuously invest in secondary deals.

This stands in contrast to traditional closed-end drawdown structures, which have finite lifespans and lock-up periods. For a deeper comparison of evergreen vs. closed-end fund structures, see our breakdown here:
Closed-End vs Evergreen Funds: Key Differences


Understanding Discounts in Secondaries

A defining feature of secondaries is the opportunity to purchase assets at a discount. This occurs when the secondary buyer acquires a position below its last reported NAV.

Typical discounts range between 10% and 15%, but they can vary widely to Premiums for high-quality or “trophy” assets and Deep discounts (up to 50%) for hard-to-value or distressed assets.


Why Do Discounts Exist?

Several key drivers create discount opportunities:

  1. Liquidity needs (e.g., LPs needing capital or rebalancing their portfolio)
  2. Unfunded commitments that represent future capital obligations
  3. Hard-to-value or illiquid assets
  4. Market dislocation or volatility

How Discounts Impact Secondary Fund Performance

When a secondary fund acquires an asset at a discount, they immediately mark it to the last NAV (Net Asset Value) because of fair market value principles and standard industry accounting practices. This results in an increase (bump) in value for the Secondary fund whenever a discounted asset is purchased by the fund.


Why Timing Matters: The Case for Investing Early

Let’s walk through a simplified hypothetical example to understand why early participation in secondary evergreen funds can be so powerful:

  • A new secondary evergreen fund raises $100 million with an initial fund priced at $10 per share.
  • It purchases assets at a 10% discount.
  • The assets are immediately marked at NAV, so the fund immediately reflects $110 million in value.
  • NAV per share jumps from $10.00 to $11.00 → a 10% gain for early investors.
  • In the following months, the fund raises another $100 million.
  • It again buys assets at a 10% discount, adding another $10 million in embedded value and the total fund value becomes $220 million.
  • The gain from the new discount ($10M) now reflects a ~5% increase across the fund.
  • NAV per share rises to approximately $11.50.

Bottom line: The earlier investor benefits not just once, but repeatedly, as new capital flows in and discounts accrue. The early investor made a nearly risk free gain of ~15% in just a few months in the above example. In addition, a portfolio of  PE assets should also gain in value of roughly 10% a year making a gain of ~30% in the first year as something very feasible through a combination of accrued discounts and asset appreciation.

A study by Cliffwater found that the first year return for the funds in secondary evergreen funds significantly outperformed returns in the second and third years—further reinforcing the value of early entry. Getting a 30% or higher return in the first year was not unusual among the funds that were studied.


Caveats

The market for secondary evergreen private equity funds stood at approximately $50 billion at the end of 2024 and is projected to grow rapidly in the years ahead. However, the maturity of the fund is just one factor in evaluating the attractiveness of a secondary fund.

Investors should also carefully evaluate:

  • The track record and experience of the manager,
  • The fee structure and liquidity terms,
  • The strategy of the fund and the quality of the assets
  • The fit of this asset class with the rest of the investor’s portfolio
  • Whether the secondary fund can grow in size over time
Conclusion

The opportunity is significant, but the window is narrow. Investors who can identify quality managers and who can commit capital in that critical first few months can benefit from a structural advantage that builds over time.

Currently, there are a number of quality managers who are launching secondary evergreen funds to compete against one another making this is an opportune time to invest in this asset class.

If you’re considering adding this strategy to your portfolio and want help evaluating options, we’re here to assist.